Cost per lease for every community, not cost per click.
We track your ads to real tours and applications, join signed leases from your property software (Entrata, RealPage, Yardi), and rank every community by what it cost to fill a unit.
From our work with Milhaus. See the case study →
Every community, side by side
Ranked, so you know where to look first.
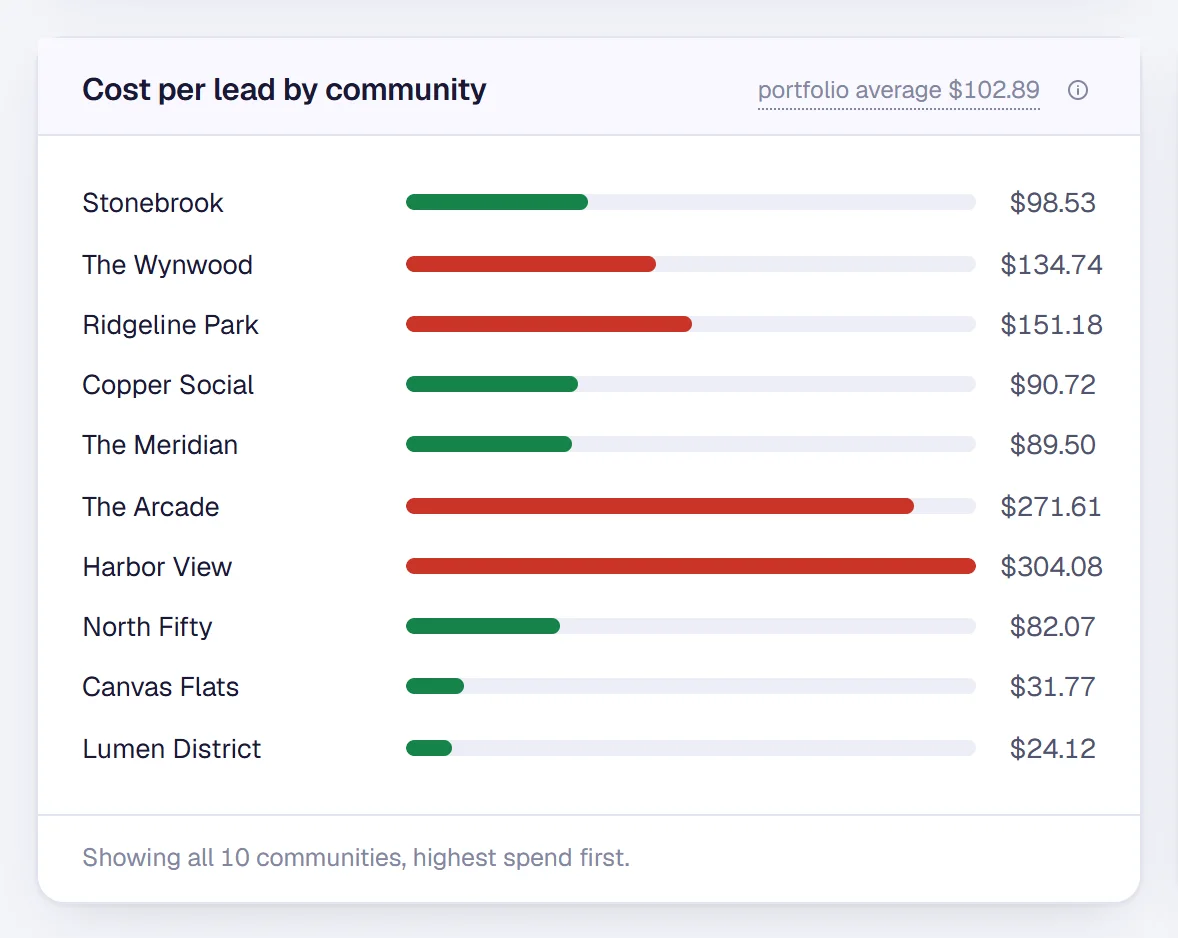
Cost per lead by community today, against the portfolio average. Signed leases from your property software (Entrata, RealPage, Yardi) join in once connected, and cost per lease shows beside it.
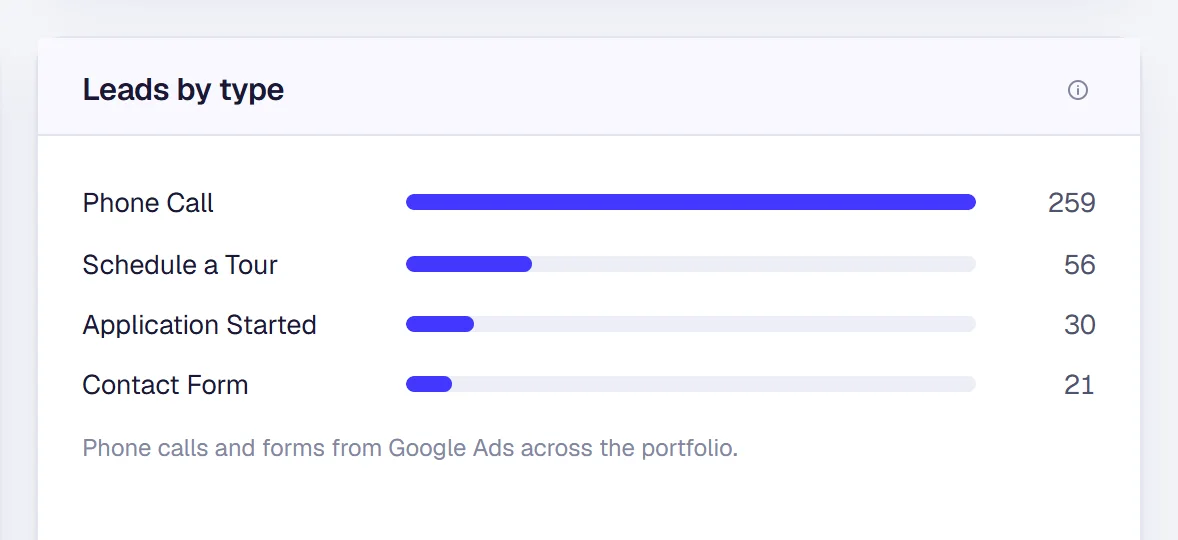
Calls, tours, applications and forms counted separately.
Each lead is counted by what the renter did: called, booked a tour, started an application or sent a form. Page views and newsletter sign-ups never count as leads.
Cost per lease reporting is included in Monitor, the base tier. Available without ad management at a 5-property minimum.
Pick how you want to start.
Click through Jamesday Marketing Pulse with a sample portfolio. No sign-up.
Open the live demo →Published, per property, month-to-month. Ads at 18% of managed spend; Monitor at $350 per property with the dashboard included.
See pricing →Thirty minutes on one of your communities: what we see and what we'd do in the first 30 days.
Book a 30-minute call →Questions about cost-per-lease reporting
How is cost per lease calculated?+
Total marketing spend for the period, ad spend plus fees, divided by the leases signed that trace back to that spend, usually within 30 to 45 days of first touch. We calculate it per community and roll it up to the portfolio, so you compare like with like.
How do you know a conversion is a real tour or application?+
Conversion actions are built around tours booked and applications started, not every form or page view. We check the tracking against your accounts regularly, so a website change can’t quietly break it, and newsletter sign-ups never count as leads.
How do leases get matched back to marketing spend?+
Signed leases come from Entrata, RealPage or Yardi, matched to the campaign or source that brought the renter. Without a direct feed we use the lead-source reports your team already runs. Matching by source keeps a listing site’s flat fee out of your paid search numbers.